Interactive Report to Launch a New Brand and Drive Growth Campaigns
Interactive Report | Firebrand Communications
Led the design and execution of an interactive report for a B2B technology client to support a brand launch and growth marketing efforts. The project required translating a complex narrative into a clear, engaging web experience under a tight timeline.
Role: Creative Lead and Program Owner
Scope: UX/UI design, interactive storytelling, layout and visual system, web experience design
Team: Design (me), project manager, copywriter, executive stakeholders
Timeline: 2 weeks
Overview
This project was part of a broader brand rollout, including a name change and website redesign. The interactive report needed to communicate key insights in a way that felt engaging, credible, and aligned with the new brand direction.
Given the complexity of the content and the short timeline, the focus was on creating a clear narrative structure and translating it into a scalable, web-first experience.


Problem
Complex, data-heavy content needed to be communicated clearly
Tight two-week timeline required fast decision-making and execution
New brand direction was still evolving during the project
Needed to balance storytelling, usability, and visual impact
Approach
Structured the report into a clear narrative flow to guide users through the content
Designed modular sections that could scale across different types of content
Used visual hierarchy and layout to simplify complex information
Collaborated closely with the project manager and copywriter in Figma for real-time feedback and iteration
Made fast, informed design decisions to keep the project moving within tight deadlines

Role and Execution
Owned the project from concept through final design, aligning stakeholders and maintaining momentum across a compressed timeline
Translated evolving brand and business requirements into a cohesive visual and interaction system
Facilitated rapid feedback cycles with stakeholders using Figma to streamline approvals
Balanced speed and quality, ensuring the final product met both design and business goals

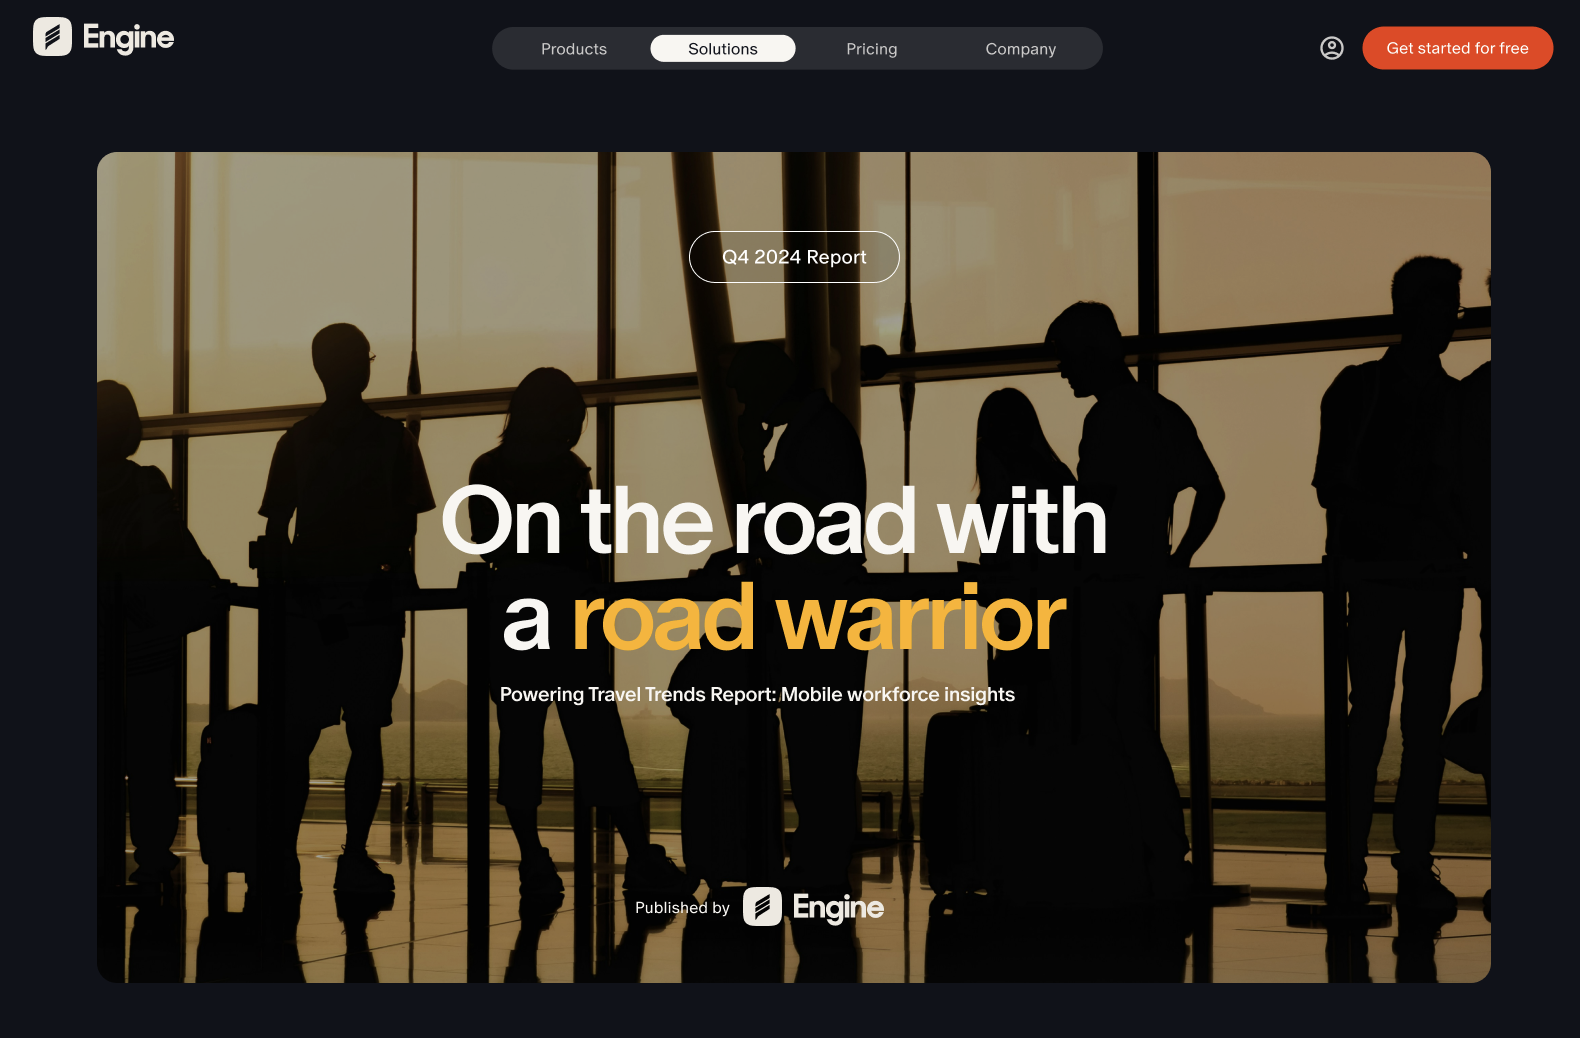
Narrative and Structure
The report was designed as a guided experience, breaking complex information into clear, digestible sections. This structure helped users move through the content without feeling overwhelmed.
Visual System
The design aligned with the client’s new brand direction, helping establish a consistent visual language that would later extend across other marketing assets.
Web-First Design
The report was designed specifically for web, ensuring layouts, spacing, and interactions translated effectively into development and supported a smooth user experience.
Outcome
Delivered a high-impact interactive report within a two-week timeline
Supported the rollout of a new brand, including a name change and website redesign
Created a flexible, web-first design system that could extend into future marketing efforts
Provided a key asset for PR and growth marketing campaigns
The web report was live for about 6 months in 2025. View the PDF version here.


